


Is a Stock Market Crash Coming Soon? History Has Good and Bad News for Investors.
Many investors aren’t quite sure how to feel about the market right now. According to a February 2026 survey from the American Association of Individual Investors, around 35% feel optimistic about the next six months, 37% feel pessimistic, and the remaining 28% feel neutral.
So if you’re having mixed feelings about investing, you’re not alone. But what does the data say about the market’s future? History has both good and bad news about where we’re headed.

Image source: Getty Images.
Stock market indicators are raising the alarm
First, the bad news: Multiple stock market metrics with a history of predicting downturns are showing red flags for investors.
The S&P 500 Shiller CAPE ratio, for example, is at nearly a record high. This metric measures the average inflation-adjusted earnings of the S&P 500 (^GSPC 0.43%) over the past 10 years, and it’s used to assess long-term valuations.
Historically, higher metrics suggest that prices could fall in the coming years. Its long-term average is around 17, and it peaked in 1999 at 44, just before the dot-com bubble burst. As of this writing, the metric is nearing 40 — the second-highest it’s ever been.
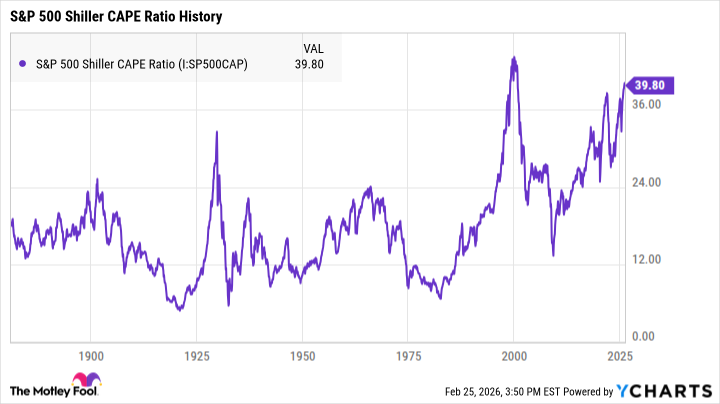
S&P 500 Shiller CAPE Ratio data by YCharts
The Buffett indicator is another metric with not-so-good news for investors. Popularized by Warren Buffett, it measures the ratio between the total value of U.S. stocks and U.S. GDP. It’s commonly used to determine market valuations, and the higher the figure, the more overvalued stock prices may be.
Warren Buffett used this metric to correctly predict the onset of the dot-com bubble burst, and in a 2001 interview with Fortune, he explained how to interpret the data:
“For me, the message of that chart is this: If the percentage relationship falls to the 70% or 80% area, buying stocks is likely to work very well for you. If the ratio approaches 200% — as it did in 1999 and a part of 2000 — you are playing with fire.”
As of this writing, the Buffett indicator sits at around 219%.
The good news for investors
No stock market indicator is 100% accurate, and even if a pullback is coming, there’s no way to know exactly when it will begin. There’s always a chance that the market could have many more months of growth still ahead before the next bear market begins, and if you stop investing now, you could miss out on substantial earnings.
While all this uncertainty can be frustrating, the good news about the market is that its long-term potential far outweighs any short-term volatility.
History has proven time and again that the market can survive even severe economic uncertainty, and it usually recovers more quickly than many people think. The average S&P 500 bear market since 1929 has lasted just 286 days, or roughly nine months. The average bull market, on the other hand, has lasted nearly three years.
The most effective way to build wealth in the stock market is to invest in quality stocks and hold them for at least several years. Short-term volatility can be tough to stomach, but a strong portfolio filled with healthy stocks can set you up for lucrative long-term earnings — no matter what happens with the market.
No comments
Be the first to comment.